UE5 Plugin
SimMind's UE5 plugin is built for fast playtest debugging. The Web Console flags what to look at; the plugin lets you open the exact location and time in Unreal Editor and inspect it with heatmaps and playback, so you can reproduce, verify, and fix without hunting.
What You'll Get
- See the pattern — heatmaps for hotspots, choke points, dead zones
- See the sequence — playback window for "what happened right before"
- Jump to the right spot — open a finding and locate the level area + time window
- Save and share moments — bookmarks you can reopen during fixing
Works with the Web Console
- Capture checklist (from Copilot) — when you start an Investigation in the Console, SimMind tells you what signals/events to add in the next playtest
- Bookmarks — save a moment during review and jump back to it later
Quickstart (5 minutes)
Step 1 — Enable the plugin
In Unreal Editor, go to: Edit → Plugins
- Search for:
BehaviorDataCaptureAndAnalysis - Check Enabled
- Unreal will prompt you to restart the editor → click Restart Now
After restart, the plugin UI becomes available.
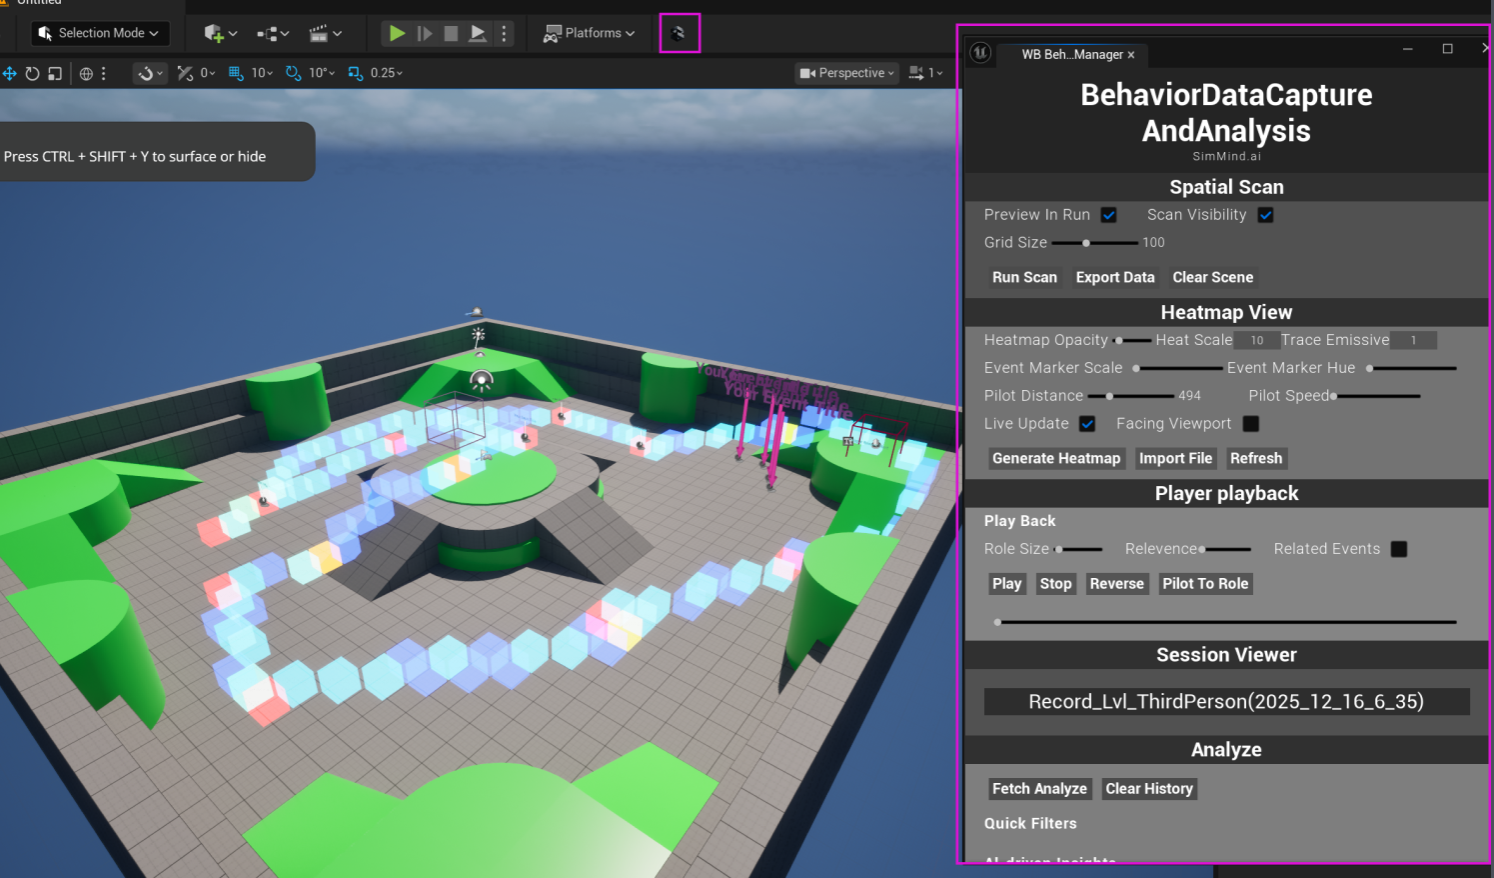
Step 2 — Open the SimMind panel (Editor Utility Widget)
- In the UE toolbar, click the SimMind icon
- This opens the plugin's Editor Utility Widget (the control panel)
Step 3 — Load a recorded session
To generate a heatmap or replay a session, you need a session recording file (JSON).
In the panel, select a recording from Session Viewer, or click Import File to load a JSON recording.
In a production workflow, recordings can be uploaded from a game build (with player consent) and analyzed in the SimMind Web Console.
What You'll See in the Panel
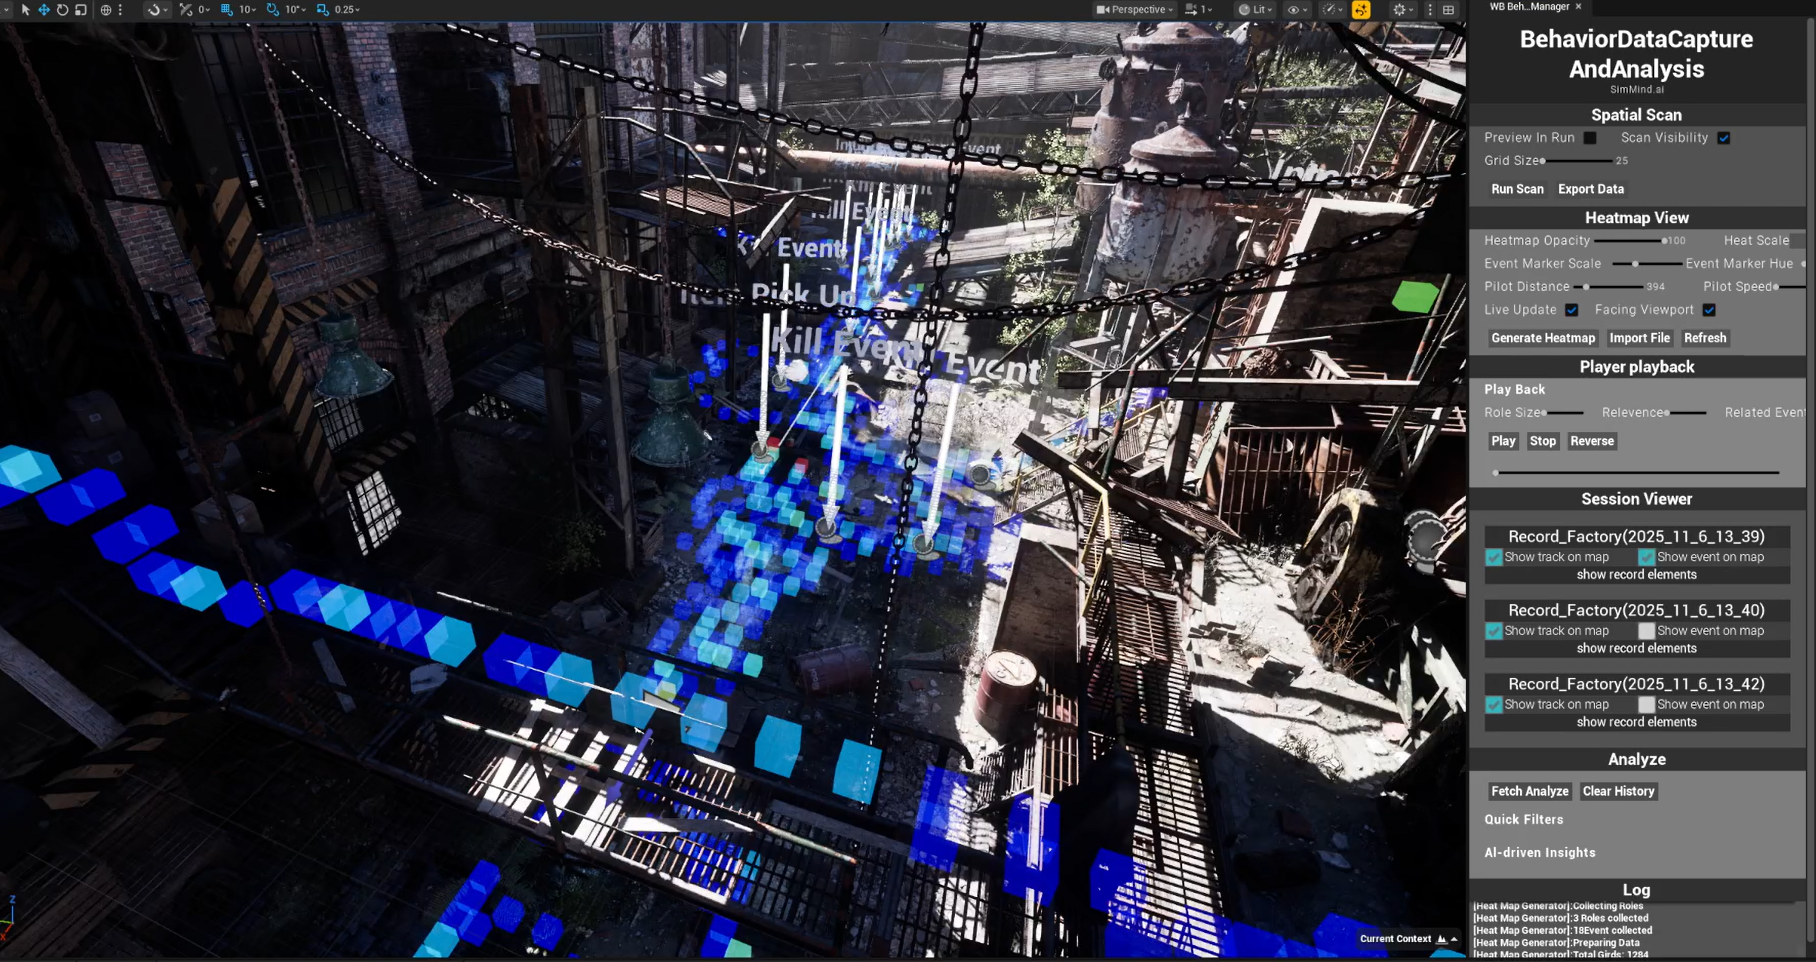
A) Heatmap View
Use this when you want patterns:
- High-traffic paths and choke points
- High-dwell hotspots (players stuck / hesitating)
- Dead zones (areas rarely visited)
Good for: routing, pacing, guidance, visibility, choke points.
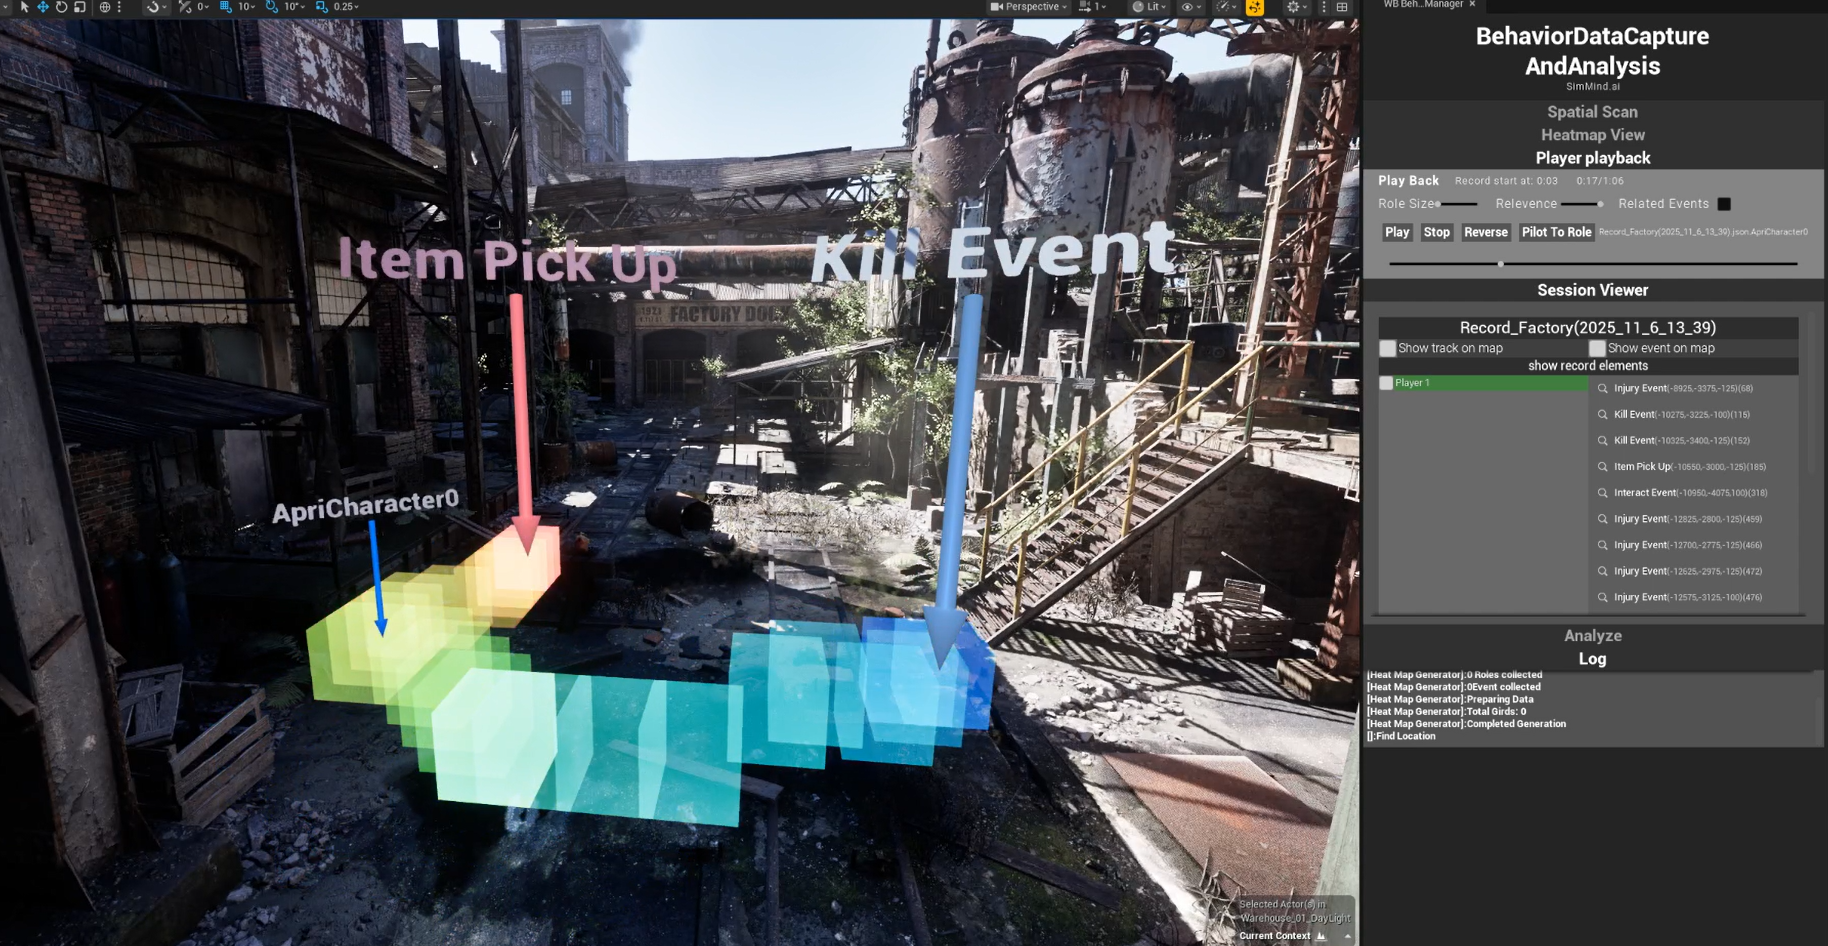
B) Player Timeline Playback
- Pre-death / pre-quit window
- What the player did right before quitting or getting stuck
- How events chain together over time
Good for: reproduction, debugging, "what exactly happened?"
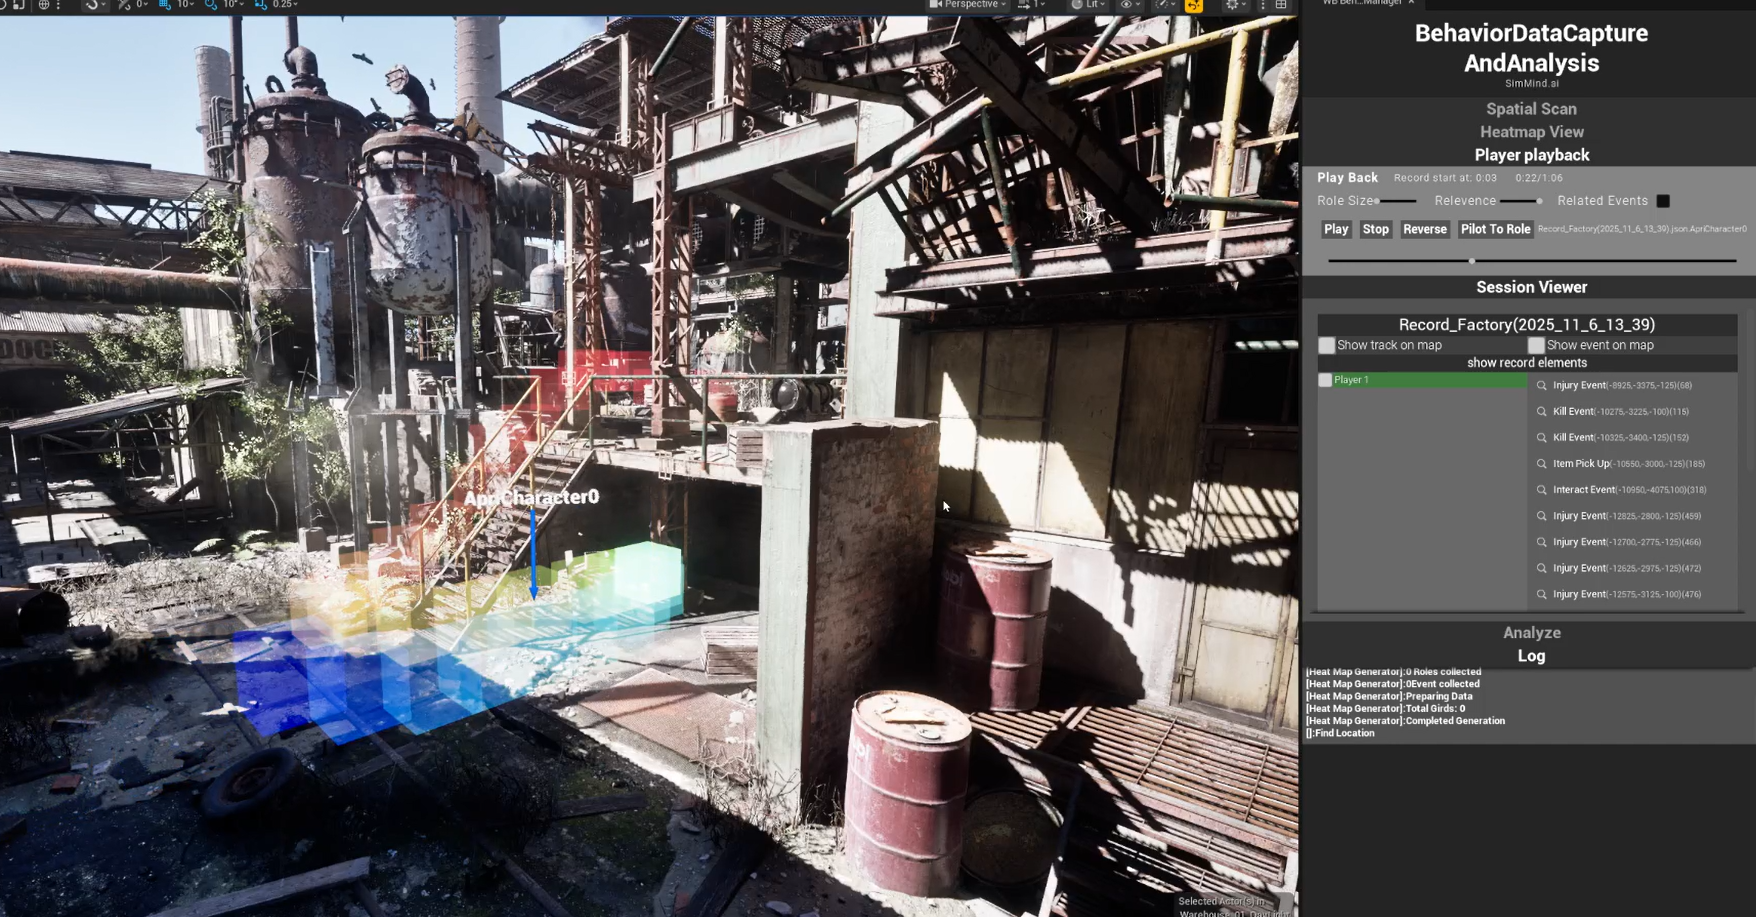
C) Session Viewer (What you're inspecting)
- Select a session
- Select an actor (player)
- See captured moments/events and jump to them on the timeline
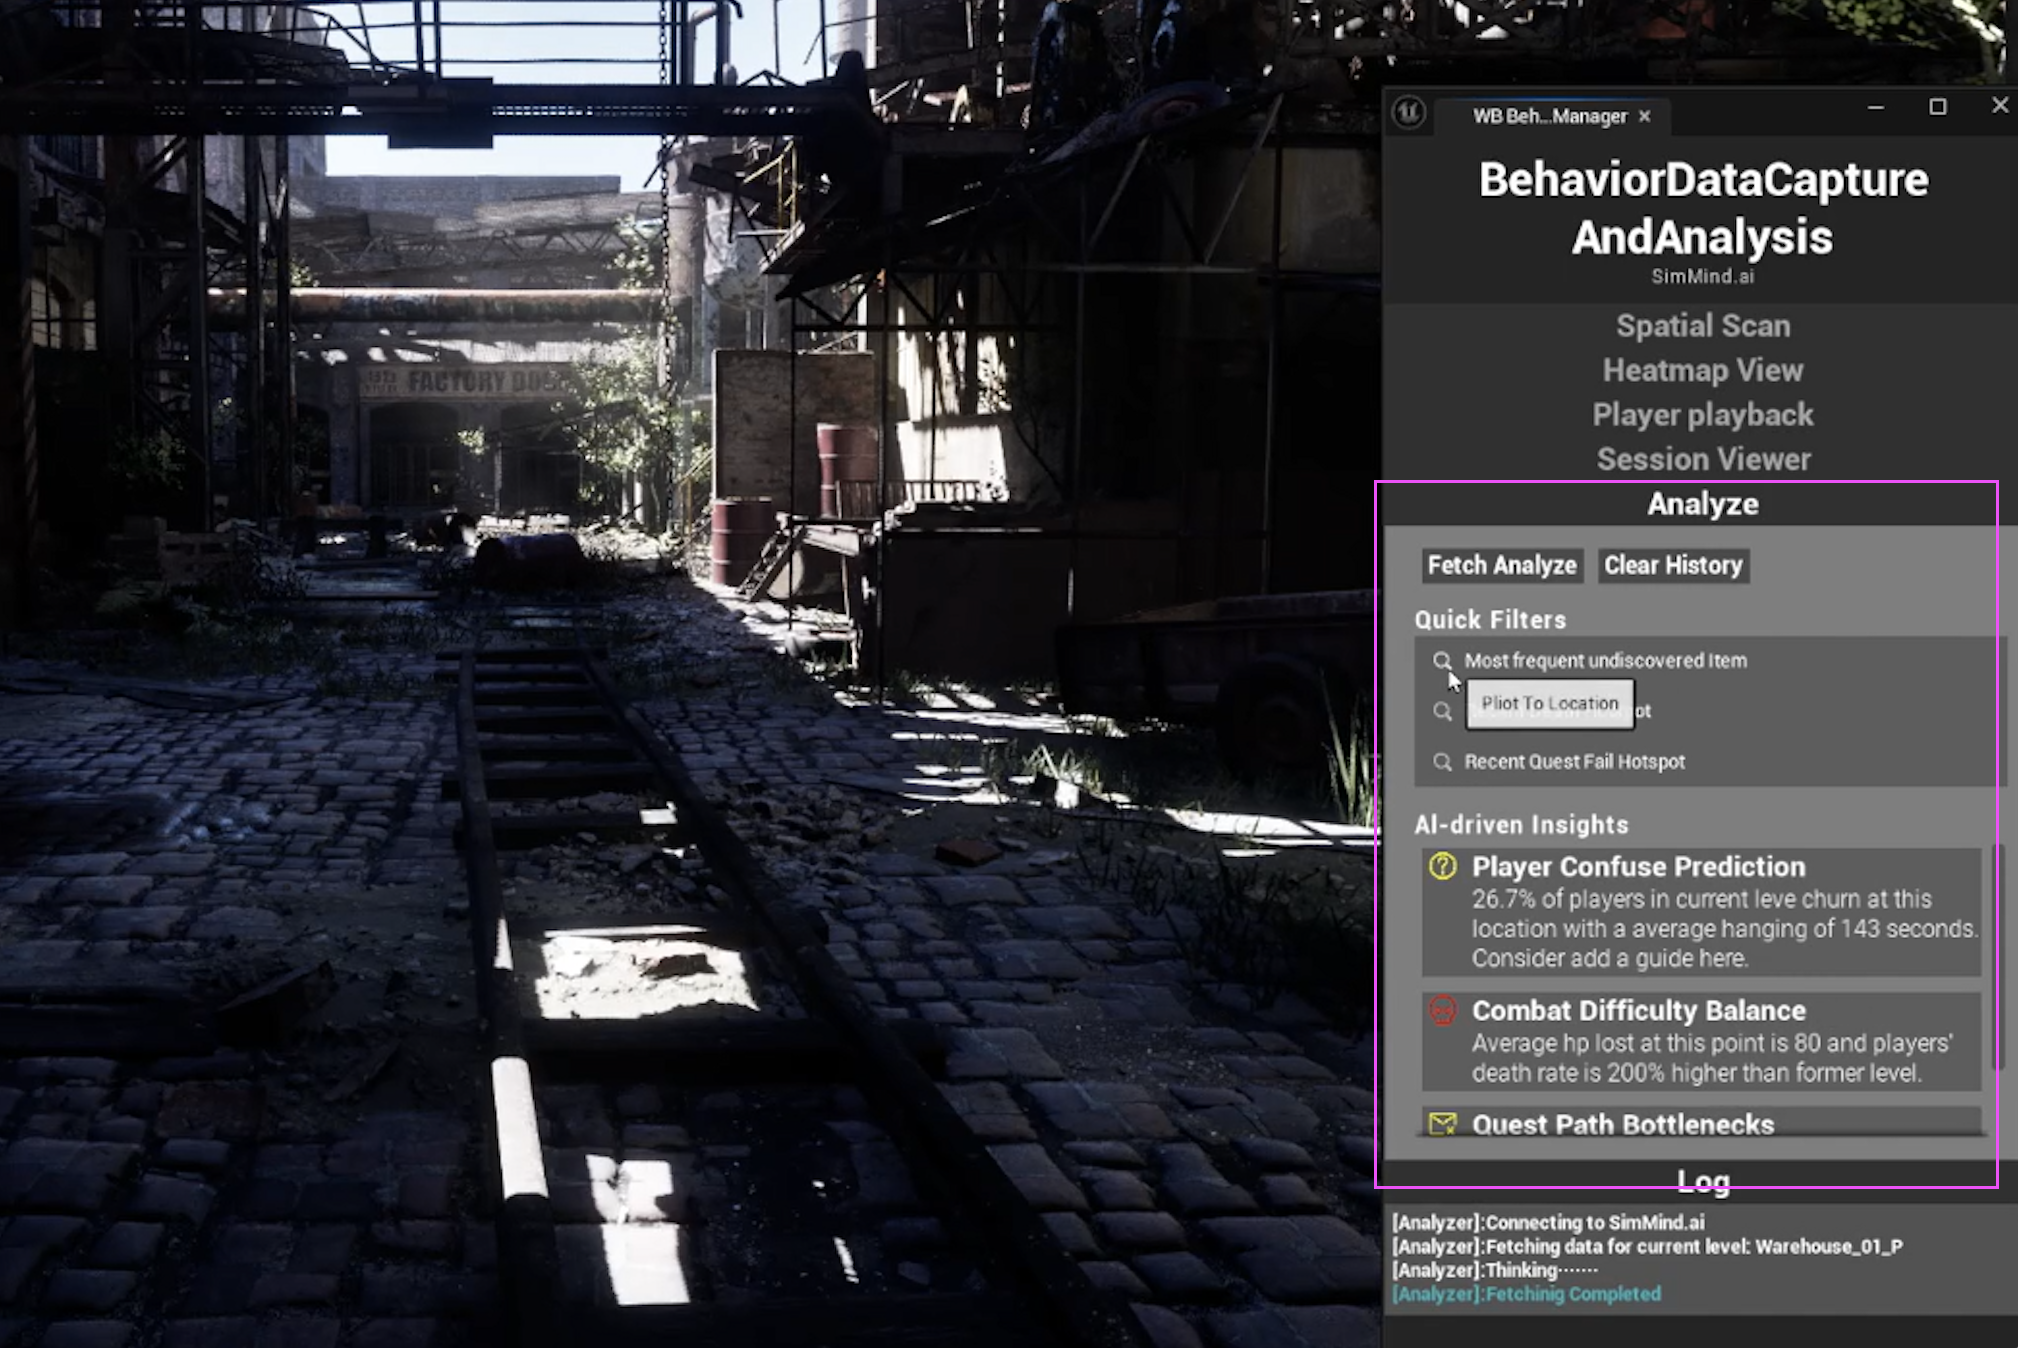
D) Analyze (Jump-to-fix)
This is for deeper debugging and team workflows:
- In the Console, SimMind generates a finding (theme / issue / investigation check)
- You open it in UE and jump to the suggested location/time window (the "magnifier" action)
E) Spatial Scan (Advanced, optional)
Purpose: Build a semantic spatial grid for your level (voxel/cube partition).
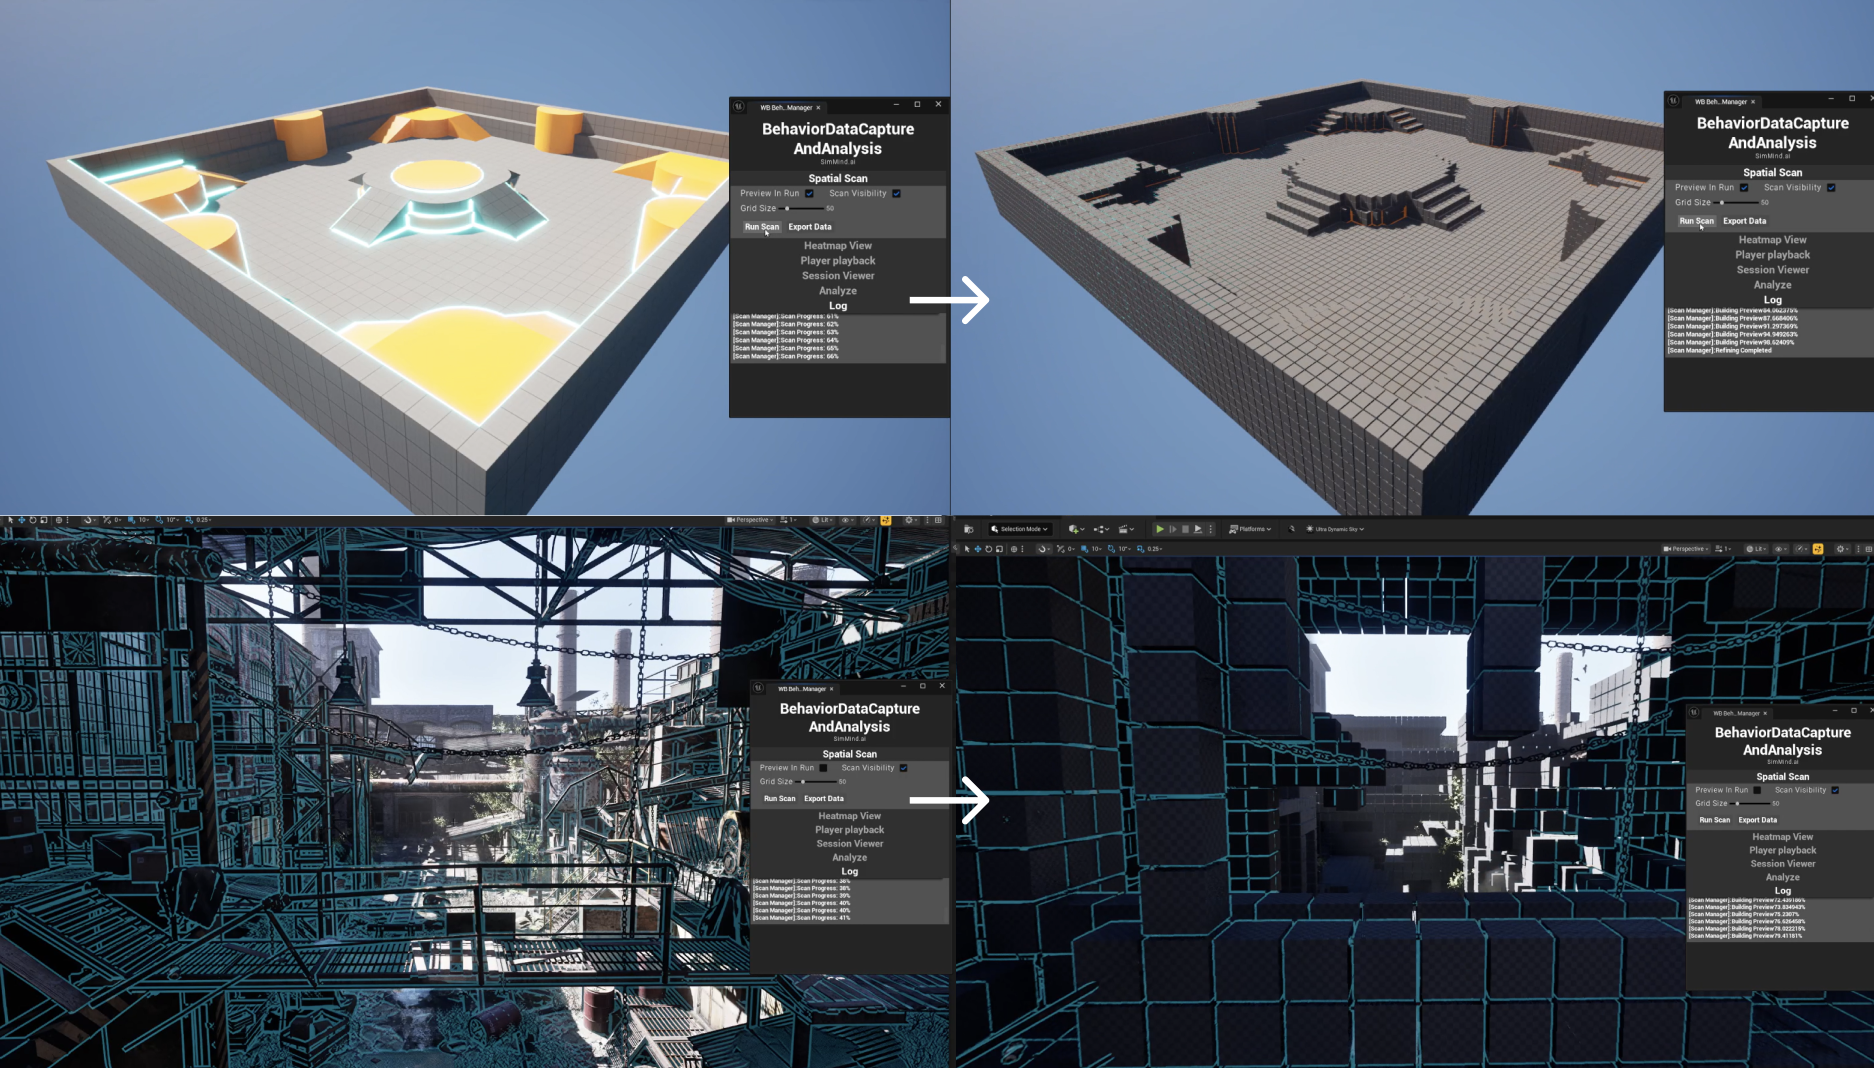
Why it matters: Later analysis can reference interpretable cells (walkable, interactable, hazard) through AI, not just raw coordinates.
What's Next?
Want better investigations? Add event instrumentation packs (Death/Damage, Checkpoints, Navigation…).